


Listening to the discussion over ULEZ expansion feels like an action replay of the way in which many were convinced to overreact to COVID, leading to policy responses which caused significantly more harm than good. The ULEZ “discussion” has all of the same elements, with modelled health benefits calculated by Imperial College model and Mayor Khan’s justification that he is “saving lives”, implying that opponents are wannabe murderers. Of course, this time around, the public is thankfully much more sceptical.
In this short note, we wanted to set out how those lives saved numbers are derived and to demonstrate that at best the numbers are seriously misrepresented and at worst completely wrong. In fact, applying the Government and Imperial’s own logic, there is a very strong case to say that the expansion of ULEZ will, on balance, harm Londoner’s health when considering the downstream economic consequences of this policy.
The major flaw in Imperial’s model is the one-dimensional nature of their assumption that air pollution drives health and life expectancy, in the real world health is driven by a number of interacting factors with income being the primary driver of health. There are many assumptions which one could dispute that (perhaps unsurprisingly) work towards inflating the claimed health benefits, but we focus only on the flaw of largely ignoring policy consequences.
Imperial presents several numbers including; attributable deaths (3,600 to 4,100), improved life expectancy (5 to 6 months) and life years saved (6.1 million). We wanted to focus on the claimed benefits of the Mayor’s Transport Strategy in terms of life expectancy and life years saved.
Before leaving attributable deaths, it is important to note that these are NOT in any sense deaths that can be avoided, nor are they deaths that are subject to reduction by the Transport Strategy. The number appears to compare current death rates with deaths rates if ALL human emissions had been removed for all prior periods. It is a theoretical construct (similar to an unmitigated pandemic) and only a small fraction of this number would be theoretically impacted by road transport (around 15%). Only the going forward numbers (life years saved) relate to the Transport Strategy and there the benefits are relatively low at 0.4%. It is important to note that as a matter of fact, there has only ever been 1 death, of a young and chronically unwell girl, ever recorded in England (56 million population) where the death certificate mentions air pollution1. Tragic as this death clearly is, it again highlights the disconnect between the theoretical attribution number and actual deaths recorded; we suggest ignoring the attributable deaths figure.
Looking at the claimed benefits of implementing the Transport Strategy it is possible for a layman to understand the main assumptions on which these health benefits are based. In summary it is assumed that reducing 10 µg m-3 achieves roughly a 6% reduction in all cause mortality. Note however 10 µg m-3 is more than ALL anthropogenic PM 2.5 emissions as estimated for England as a whole, so any benefits are scaled down from 6%. So a 1 µg m-3 reduction generates roughly a 0.6% improvement in life expectancy.
Looking at life years saved and extended life expectancy, the key assumptions are poorly explained. For those in a hurry, the detail shows that ALL of the Transport Strategy initiatives to 2050 combined will deliver a projected 0.4% reduction in life years lost to air pollution using projections to 2154. There is a claimed 5 – 6 month extension in life expectancy, so the life expectancy of a London male of around 80 years would be extended to around 80.4 years.
These gains are stated relative to a base line and for some inexplicable reason Imperial has decide to use 2013 pollution levels to establish the baseline and in the process to ignore the available data for 2019. This serves to inflate the baseline.
Assessing whether the results of modelling are compatible with observed reality is the acid test and, on this basis, the Imperial ULEZ modelling falls flat. The model covers the impact of the entire Transport Strategy to 2050 which covers many more steps than ULEZ. The Imperial document is somewhat vague about what those steps are, which are cryptically referred to as 2025 LES, 2030 LES and 2050 LES. It is enough to note that the aim of Mayor Khan’s 2018 Transport Strategy is to “aim for 80% of all trips in London to be made on foot, by cycle or using public transport by 2041”2. So the first thing to clarify is that the claimed 6.1 million saving of life years relates to a significant number of measures, well beyond ULEZ expansion. In effect these combined steps will largely eliminate private car traffic.
The chart below is constructed from the Imperial material and shows that PM 2.5 µg m-3 population weighted (PWAC) pollution falls over a number of steps and ULEZ on a standalone basis, has a near zero impact. Also, you can also see that a fair chunk of gains have already been banked between 2013 and 2019.


There is a slightly better outcome for NOx pollutants which are reduced by 5.4% across Greater London. This feeds in to the health impact assessment which unsurprisingly shows near zero benefit from ULEZ for PM 2.5 reductions, for most health related metrics.
Looking at life expectancy, the report does acknowledge that due to the large population (around 8.9 million) and the extraordinary long time period over which these benefits are expected to crystalise (up to 2154) then there are around 1.5 billion life years involved (years x population). For any stated benefit to be meaningful, it needs to referenced to the base case value. The 6.1 million life years saved is then within the context of a total of around 1.5 billion life years 4, this saving then is around 0.4%. Correspondingly, the impact on life expectancy from ALL of the pollution schemes adds up to around 22 to 27 weeks additional life expectancy. In the context of male life expectancy of 80 years (roughly) this would improve to 80.4 years as a consequence of 30 years’ worth of restrictive climate policies (ignoring any economic consequences).
The core flaw in the calculation is the one-dimensional thinking that underpins this (and all similar calculations) in that all reductions in PM 2.5 concentrations lead to a reduction in the mortality rate. This thinking ignores any link between people’s incomes and health outcomes, which is the primary driver of health. This is the same dishonest cop out that Professor Ferguson made in his infamous COVID paper. This facilitates a myopic focus on “safety” and generates solutions that do far more harm than good.
Asserting that health outcomes improve with a reduction in air pollution on a more or less linear basis runs contrary to the government’s own data5 (based on the real world); this assumption is not correct or, at least, is over-simplified. Indeed, government data for various regions of the UK shows, if anything, this relationship is reversed.
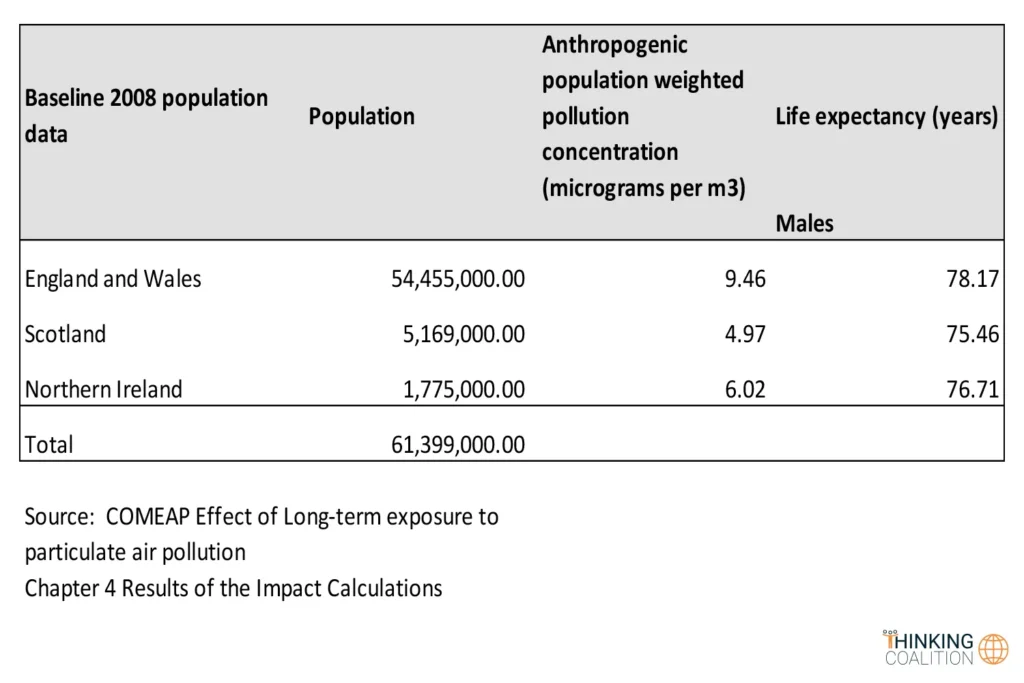
Life expectancy in Scotland is much lower despite having far and away the lowest concentration of anthropogenic PM 2.5 pollutants. Many studies with and between countries show this clearly (e.g. life expectancies by national deprivation deciles, England: 2018 to 2020)6.
In order to get a handle on how much more significant factors other than PM 2.5 can be, we looked at a recent paper that considers the impact of changes in different factors on life expectancy across 29 European countries7 , here also they are looking at each factor in isolation using multivariate analysis. The chart below shows the life expectancy impact of a 1% change in the listed factors. There are of course some caveats, but you can immediately see that economic activity dominates the outcomes with a 13 month gain in life expectancy for a 1% gain in GDP versus say a 2.7 month gain for a 1% change in PM 10-2.5. Also note there is no statistically significant relationship between CO2 and life expectancy.
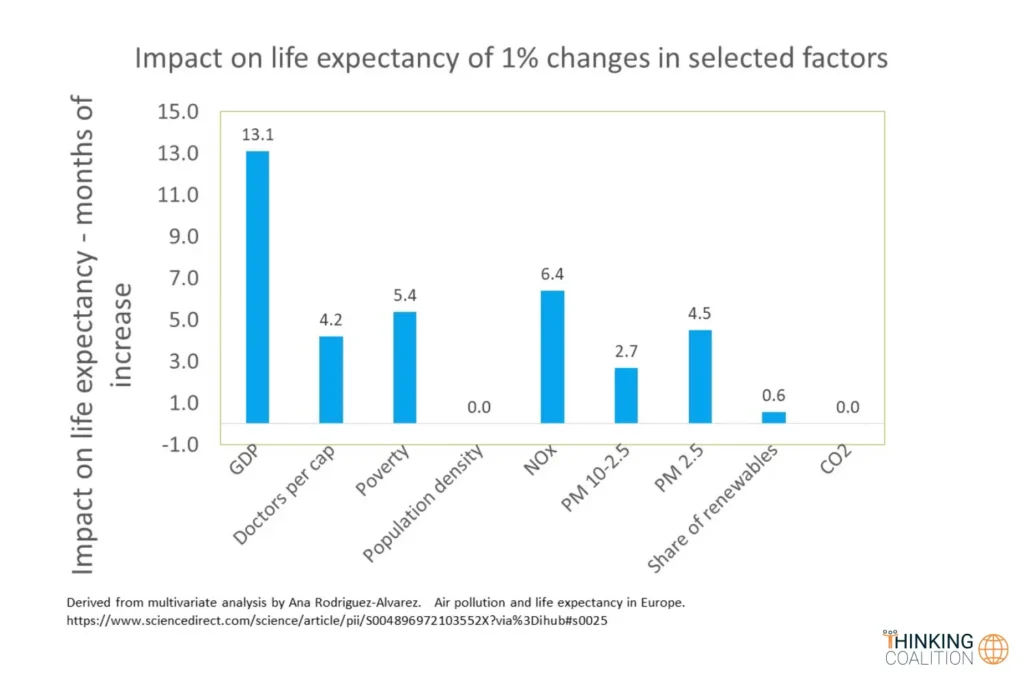
In another section of the same paper the author states “France and Sweden, some of the countries closest to their potential LE (life expectancies), are also amongst those with the highest NOx level”. The real message though is that if you dent people’s income by narrowly pursuing PM 2.5 reduction, you will, on balance, shorten life expectancy and not increase it. The Jacobs’ report confirms that there will be multiple negative impacts on business and economic activity. We guess that on balance ULEZ will lower life expectancy when factoring in the impacts on business and family incomes, as well as quality of life considerations.
In the post COVID world, we have understood that politicians of all stripes will shamelessly use emotional manipulation in order to get reasonable people to comply with their unreasonable edicts. That is why understanding how reliable, or otherwise, attributable deaths, life years saved and life expectancy figures are is so important. You can almost guarantee that these estimates will be manipulated and potentially used to rationalise illogical and damaging policies, with opaque models it is relatively easy to produce results to order.
The political process implies that the individuals involved are able to understand competing objectives and arrive at a sensible compromise. However we saw in the case of COVID, that many politicians have limited scientific understanding and will tend to pursue unachievable safety, at any cost.
The State seems to be redefining its role with a narrow group of ideologically driven technocrats setting somewhat arbitrary targets. Achieving those targets requires wholesale changes to people’s lives. Very often economic, mental and other impacts are barely considered and historically established constitutional boundaries between the State and the citizens are often ignored.
In the case of ULEZ expansion, the 59% of respondents to the public consultation who clearly opposed the expansion were simply ignored8.
Various sops will no doubt be offered to voters, but is it important that readers realise that there is a direction of travel to these various steps. Finally, remember Albert Camus’ wise warning that “The welfare of humanity is always the alibi of tyrants.”
Alex Kriel is by training a physicist and was one of the first people to highlight the flawed nature of the Imperial COVID model7, he is a founder of the Thinking Coalition which comprises a group of citizens who are concerned about Government overreach (www.thinkingcoalition.com).
Every effort has been made to make the note accurate, since this summarises several hundred pages of documents, simplifications have necessarily been made. Since the author is not a specialist in mortality studies, errors of interpretation cannot be excluded. Please follow us to see further videos and papers about this topic and support us on Patreon (Patreon/ThinkingSlow).
References
- https://qna.files.parliament.uk/qna-attachments/1423226/original/UKSA’s%20Response%20to%20PQ125491.pdf
- https://www.london.gov.uk/sites/default/files/mayors-transport-strategy-2018.pdf
- https://ehq-production-europe.s3.eu-west-1.amazonaws.com/2e0438f24520ece474690bb99a94108e4a555b1e/original/1652882837/c7731c1b9dd3c304567a31d5b4816351_London-wide_ULEZ_Integrated_Impact_Assessment_%28ULEZ_Scheme_IIA%29_%282%29.pdf
- The number in the Imperial paper of 1.5 billion life years over the forecast period is higher than would be implied by the population x years of forecast period and we are not sure why that is.
- https://www.gov.uk/government/publications/comeap-mortality-effects-of-long-term-exposure-to-particulate-air-pollution-in-the-uk
- https://www.sciencedirect.com/science/article/pii/S004896972103552X?via%3Dihub#s0025
- https://www.telegraph.co.uk/business/2023/01/16/london-mayor-sadiq-khan-accused-manipulating-poll-expand-ulez/
- https://twitter.com/ThinkingSlow1/status/1257578069797339137?s=20


